
What Is a Visual Behavior Chart for Kids?
Discover what a visual behavior chart is and how it helps kids understand expectations, boosting emotional and sensory regulation effectively.
What Is a Visual Behavior Chart for Kids?
TL;DR:
- A visual behavior chart is a structured tool that makes behavior expectations concrete, visible, and trackable for children who struggle to internalize abstract rules. They help reduce anxiety, support emotional regulation, and foster a shared understanding among caregivers and educators, but must be personalized, consistently maintained, and thoughtfully phased out over time. When used effectively, these charts promote goal achievement, self-esteem, and intrinsic motivation in children across home, school, and therapy settings.
Most parents and educators think of behavior charts as glorified sticker sheets. You do the thing, you get the star, repeat. But a visual behavior chart is something far more purposeful than that. At its core, it’s a structured tool that makes behavior expectations concrete, visible, and trackable for children who struggle to internalize abstract rules. When used thoughtfully, these charts become a foundation for emotional and sensory regulation, not just a reward delivery system. This article covers what they are, how they work, which types to use, and how to get the most out of them at home and in the classroom.
Table of Contents
- What is a visual behavior chart and how it works
- Types of visual behavior charts
- Benefits and potential pitfalls of behavior charts
- How to implement a behavior chart at home or in school
- Behavior charts in therapy and emotional regulation
- My take on using behavior charts well
- Build on your charts with Growingbalanced
- FAQ
What is a visual behavior chart and how it works
A visual behavior chart is a structured, visual tracking tool designed to make behavior expectations concrete and measurable. Instead of telling a child to “be responsible” or “stay calm,” the chart breaks those ideas down into specific, observable actions. Think: “put your backpack away after school,” “use a quiet voice in the hallway,” or “take three deep breaths when frustrated.”
The basic components of any behavior chart include:
- Target behaviors: The specific actions you want to encourage or track
- A tracking system: Stickers, checkmarks, color-coded zones, or digital markers
- A feedback loop: Daily review of progress with the child
- A reward or recognition structure: Tied to reaching agreed-upon goals
Charts come in many formats. Paper sticker sheets work well for young children who respond to tangible visuals. Whiteboards allow for easy daily resets without waste. Apps and digital platforms add interactivity and data logging, which is especially useful for therapists and educators who need to monitor trends over time.
What makes these tools powerful is not the format itself. It’s the fact that they transform abstract expectations into visible goals. A child who cannot yet self-monitor their behavior can look at a chart and understand exactly what success looks like today. That clarity reduces anxiety and builds a sense of predictability, which is especially critical for children with sensory processing differences or emotional regulation challenges.
Types of visual behavior charts
Not all behavior charts serve the same purpose, and choosing the wrong type can reduce effectiveness. Here is a breakdown of the most common formats and when each one fits best.
Chore charts focus on routine tasks like brushing teeth, making the bed, or completing homework. They are best for building daily habits and work well for children ages four and up. The goal is consistency, not complex behavior change.
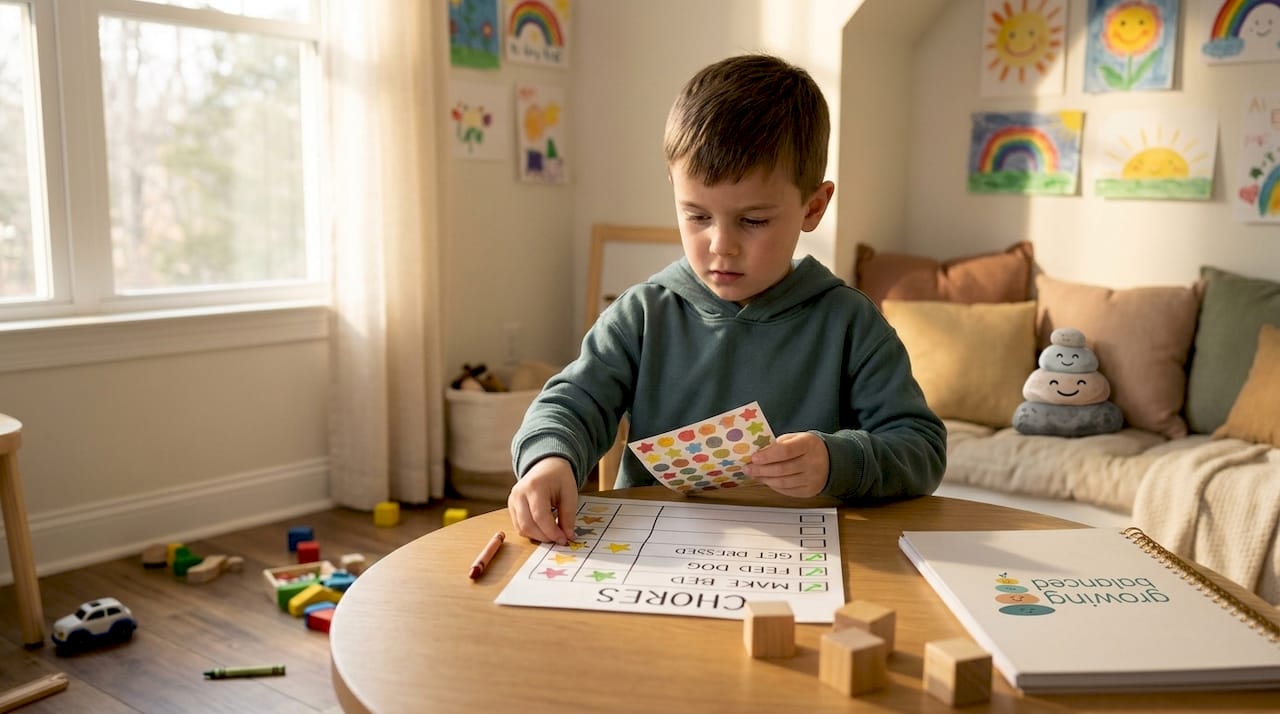
Reward charts track progress toward a specific incentive. A child earns points or stickers for target behaviors and exchanges them for a reward once a threshold is reached. These are effective for short-term behavior goals but require careful planning to avoid reward dependency.
ABA therapy charts are used in Applied Behavior Analysis settings and include more sophisticated data formats. ABA therapy charts use line graphs to track behavior over time, bar graphs to compare behavior across categories, and scatterplots to identify patterns and correlations. These are typically managed by therapists but can be shared with parents and teachers to align support across settings.
| Chart type | Best for | Typical setting | Data complexity |
|---|---|---|---|
| Chore chart | Daily routines and habits | Home | Low |
| Reward chart | Short-term behavior goals | Home or classroom | Low to medium |
| Emotion/regulation chart | Sensory and emotional tracking | Home, school, therapy | Medium |
| ABA line graph | Trend monitoring over time | Therapy or clinical | High |
| Scatterplot chart | Identifying behavior triggers | Therapy | High |
Matching the chart type to the child’s developmental stage and emotional needs matters more than finding the “perfect” template. A five-year-old building morning routine habits needs a simple visual checklist. A child in ABA therapy working on reducing meltdown frequency needs a data-driven graph that a therapist can analyze across weeks.
Benefits and potential pitfalls of behavior charts
The benefits of visual behavior charts are well-documented, but so are the ways they go wrong. Understanding both sides helps you use them in ways that actually build children up.
On the positive side, these charts:
- Give children a clear picture of what is expected, reducing confusion and anxiety
- Provide positive reinforcement that supports self-regulation development
- Make abstract social skills like sharing and turn-taking visible and rewarding, which supports social-emotional growth
- Create a shared language between parents, teachers, and therapists
- Build a sense of accomplishment and self-esteem when children meet their goals
The pitfalls are real, though. Public behavior charts that display a child’s failures in front of peers increase anxiety and damage trust. Charts that focus on punishing bad behavior rather than reinforcing good behavior teach children to fear failure rather than pursue success. And charts that rely too heavily on external rewards can actually reduce a child’s internal drive over time.
The fix for most of these problems is the same: keep charts private, keep them positive, and keep them personalized. A chart that works for one child may completely miss the mark for another. The behavior you track, the reward you offer, and the way you review progress together all need to fit the individual child.
Pro Tip: Plan from the start to fade out the chart. As a child internalizes a behavior, gradually reduce reward frequency rather than stopping abruptly. This preserves motivation and helps the behavior stick without ongoing external reinforcement.
How to implement a behavior chart at home or in school
Setting up a chart is the easy part. Making it work over time takes consistency and collaboration. Here is a process that holds up in both home and classroom settings.
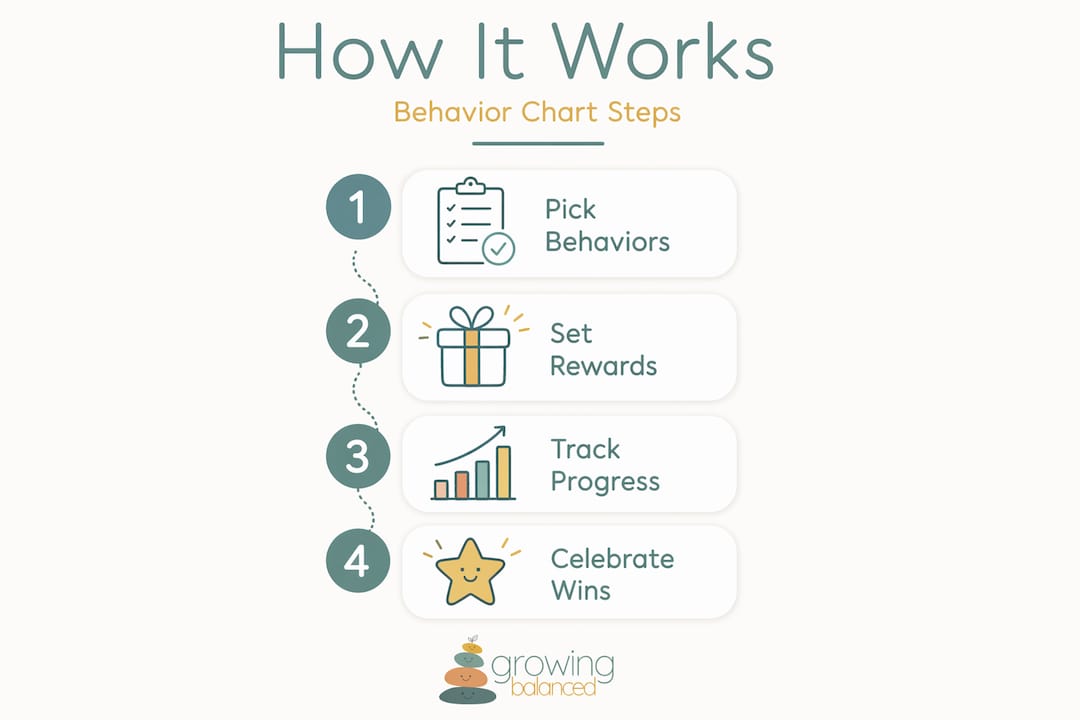
- Identify the target behavior together. Sit down with the child and talk about what you both want to work on. Children who help choose the goal feel more ownership over the outcome.
- Define the behavior in observable terms. “Be good” is not trackable. “Raise your hand before speaking” is. Specificity is everything.
- Choose a format that fits the child. Younger children do well with picture-based charts. Older children may prefer a simple checklist or a digital app.
- Set a realistic reward. The reward should be meaningful to the child, not just convenient for the adult. Ask what they would like to work toward.
- Update the chart every single day. Daily consistency in feedback is what builds trust and keeps the system credible. Skipping days erodes the structure.
- Review progress together. Spend two minutes each evening or at the end of the school day looking at the chart with the child. Celebrate progress. Talk about what was hard without shame.
- Adjust as needed. If a behavior is consistently not being met, the goal may be too big. Break it into smaller steps and recalibrate.
Pro Tip: Pair your chart with a restorative conversation when a child misses a goal. Asking “what got in the way?” builds emotional intelligence alongside behavior tracking, which produces much longer-lasting results.
Behavior charts in therapy and emotional regulation
In therapeutic contexts, visual behavior tracking goes well beyond checking off tasks. Visual data supports informed intervention by turning raw behavior patterns into something parents, educators, and therapists can analyze together and act on with precision.
In ABA therapy, for example, frequency graphs tracking behavior trends over eight-week periods are standard practice. These graphs reveal whether an intervention is working, whether a behavior is escalating, or whether a trigger is environmental. That kind of insight is impossible to gather from memory alone.
| Context | Chart function | Who benefits |
|---|---|---|
| Home ABA therapy | Tracks frequency and trends | Child, parent, therapist |
| Classroom | Monitors daily conduct and routines | Child, teacher |
| Sensory regulation | Identifies triggers and relief patterns | Child, OT, parent |
| Emotional regulation | Tracks mood and coping strategy use | Child, counselor |
Charts also serve as a communication tool. When a parent can show a therapist a week’s worth of visual data, the conversation shifts from “I think things are getting better” to “here is exactly what changed and when.” That specificity drives better decisions. Paired with an emotional regulation workflow, visual charts become part of a larger system that supports children’s well-being across every environment they move through.
My take on using behavior charts well
I’ve worked with enough families and educators to know that behavior charts get misused more often than people admit. The chart goes up on the wall, the child earns a few stickers, and then life gets busy. The chart stops being updated. The reward never materializes. The child learns that the system isn’t real, and trust takes a hit.
What I’ve seen actually work is treating the chart as a conversation, not a contract. The chart format matters far less than the relationship and consistency behind it. I’ve watched simple hand-drawn charts outperform expensive apps because the adult using the hand-drawn chart showed up every single day, talked with the child about their progress, and genuinely celebrated small wins.
I also think we underestimate how much children want to succeed. When a chart is private, positive, and built around something the child actually cares about, engagement is almost always high. The problem comes when adults use charts to manage their own stress rather than to support the child’s growth. That shift in motive changes everything.
My honest advice: use charts as temporary scaffolds. The goal is always to build intrinsic motivation, not to create a child who only behaves when a reward is on the table. Start with the chart, fade it thoughtfully, and replace it with genuine connection and co-created agreements as the child matures.
— Kelsey
Build on your charts with Growingbalanced
If behavior charts are the foundation, daily visual schedules are the structure built on top. Growingbalanced offers OT-informed tools designed specifically for parents, teachers, and therapists who want to move beyond basic charts and into personalized, sustainable routines.
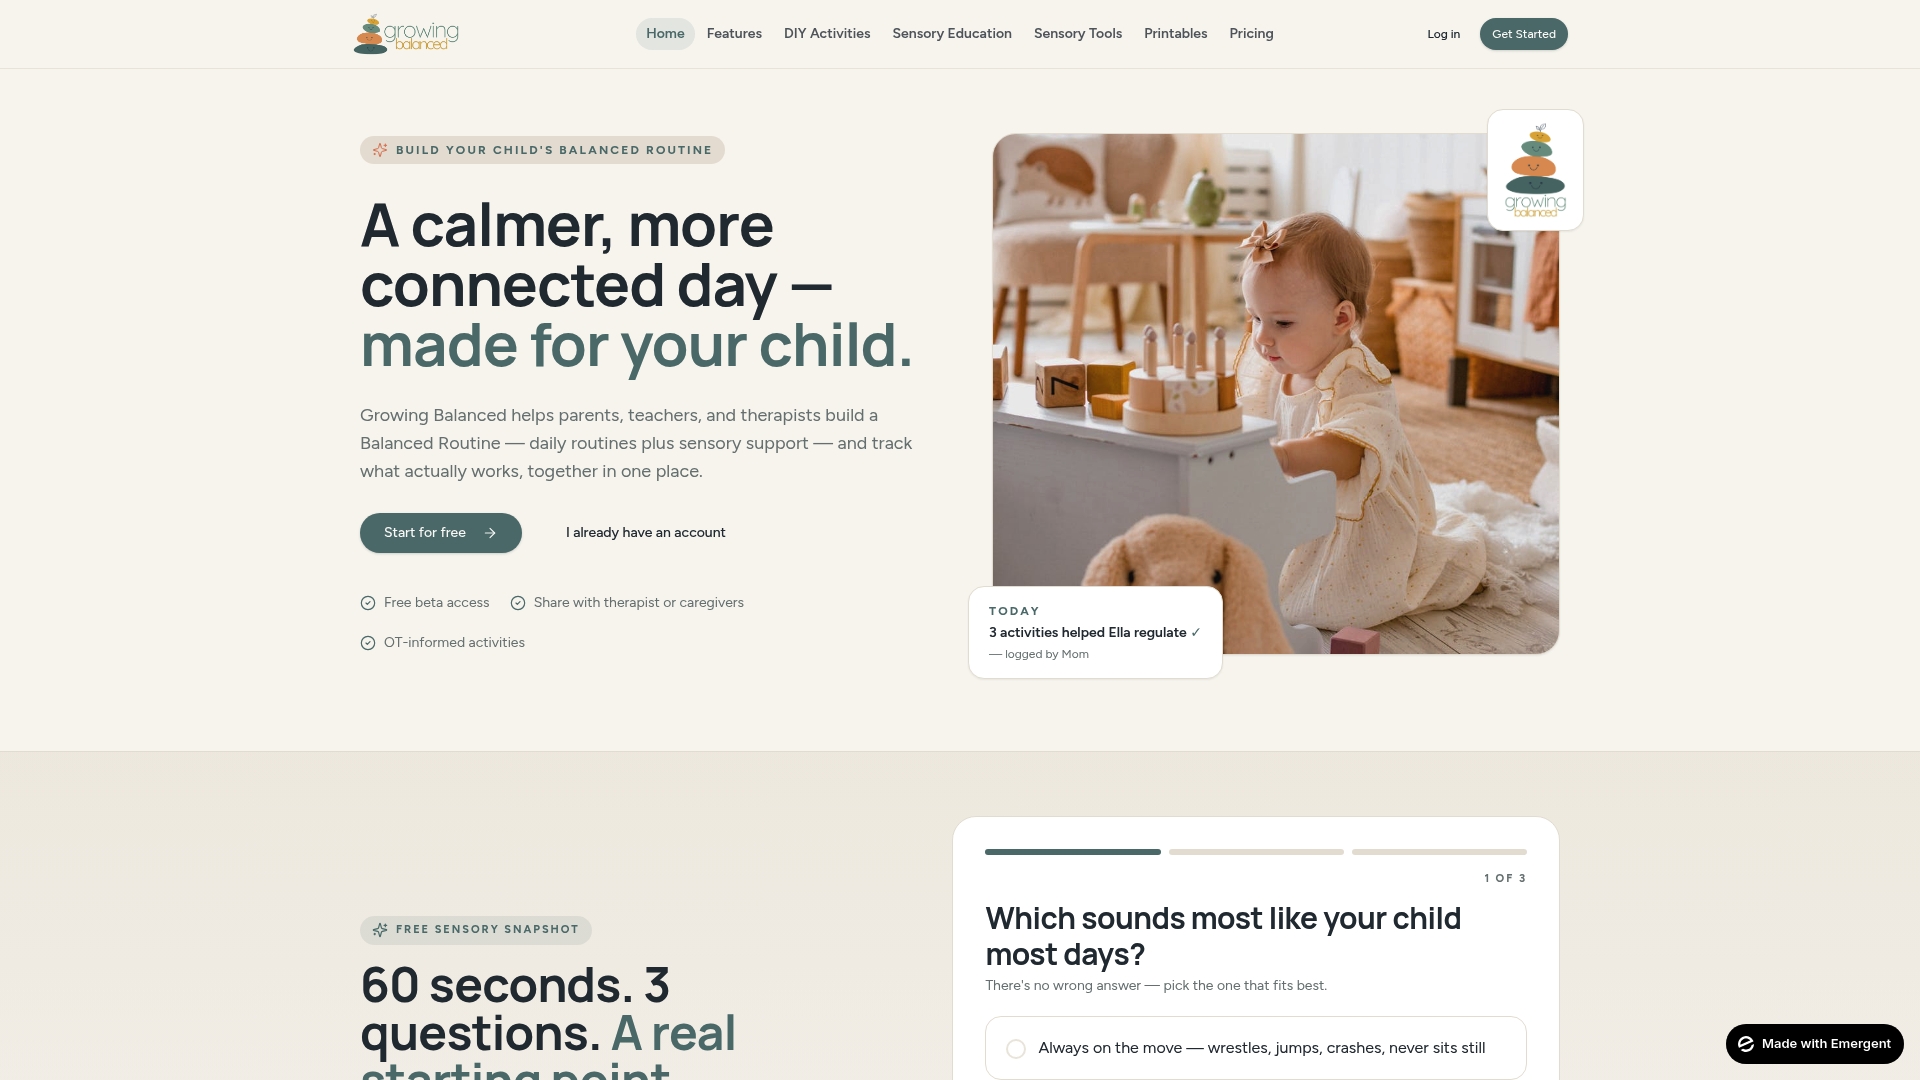
The platform’s visual scheduling tools let you create customized daily routines that support emotional and sensory regulation, track progress, and share plans across caregivers. Whether you are managing a child’s morning routine at home or supporting a classroom full of diverse learners, Growingbalanced gives you the structure to make visual behavior tracking actually stick. Explore the free resources and printable materials to get started today.
FAQ
What is a visual behavior chart?
A visual behavior chart is a structured tracking tool that makes behavior expectations visible and measurable for children. It typically includes target behaviors, a tracking system like stickers or checkmarks, and a feedback or reward structure.
What age is best for starting a behavior chart?
Most children can benefit from simple visual behavior charts starting around age three or four, especially picture-based formats. Older children and teens can use more data-driven or self-monitoring chart styles.
How do behavior charts support emotional regulation?
By making expectations clear and predictable, behavior charts reduce anxiety and help children recognize patterns in their own behavior. When paired with co-regulation strategies, they become a tool for building genuine self-regulation skills.
What are the biggest mistakes parents make with behavior charts?
The most common mistakes are using public charts that shame children in front of others, focusing on punishing negative behavior instead of reinforcing positive behavior, and failing to update the chart consistently. All three undermine trust and effectiveness.
When should you stop using a behavior chart?
Charts should be faded gradually as a child internalizes the target behavior. Rather than stopping abruptly, reduce the reward frequency over time so the behavior becomes self-sustaining without ongoing external reinforcement.